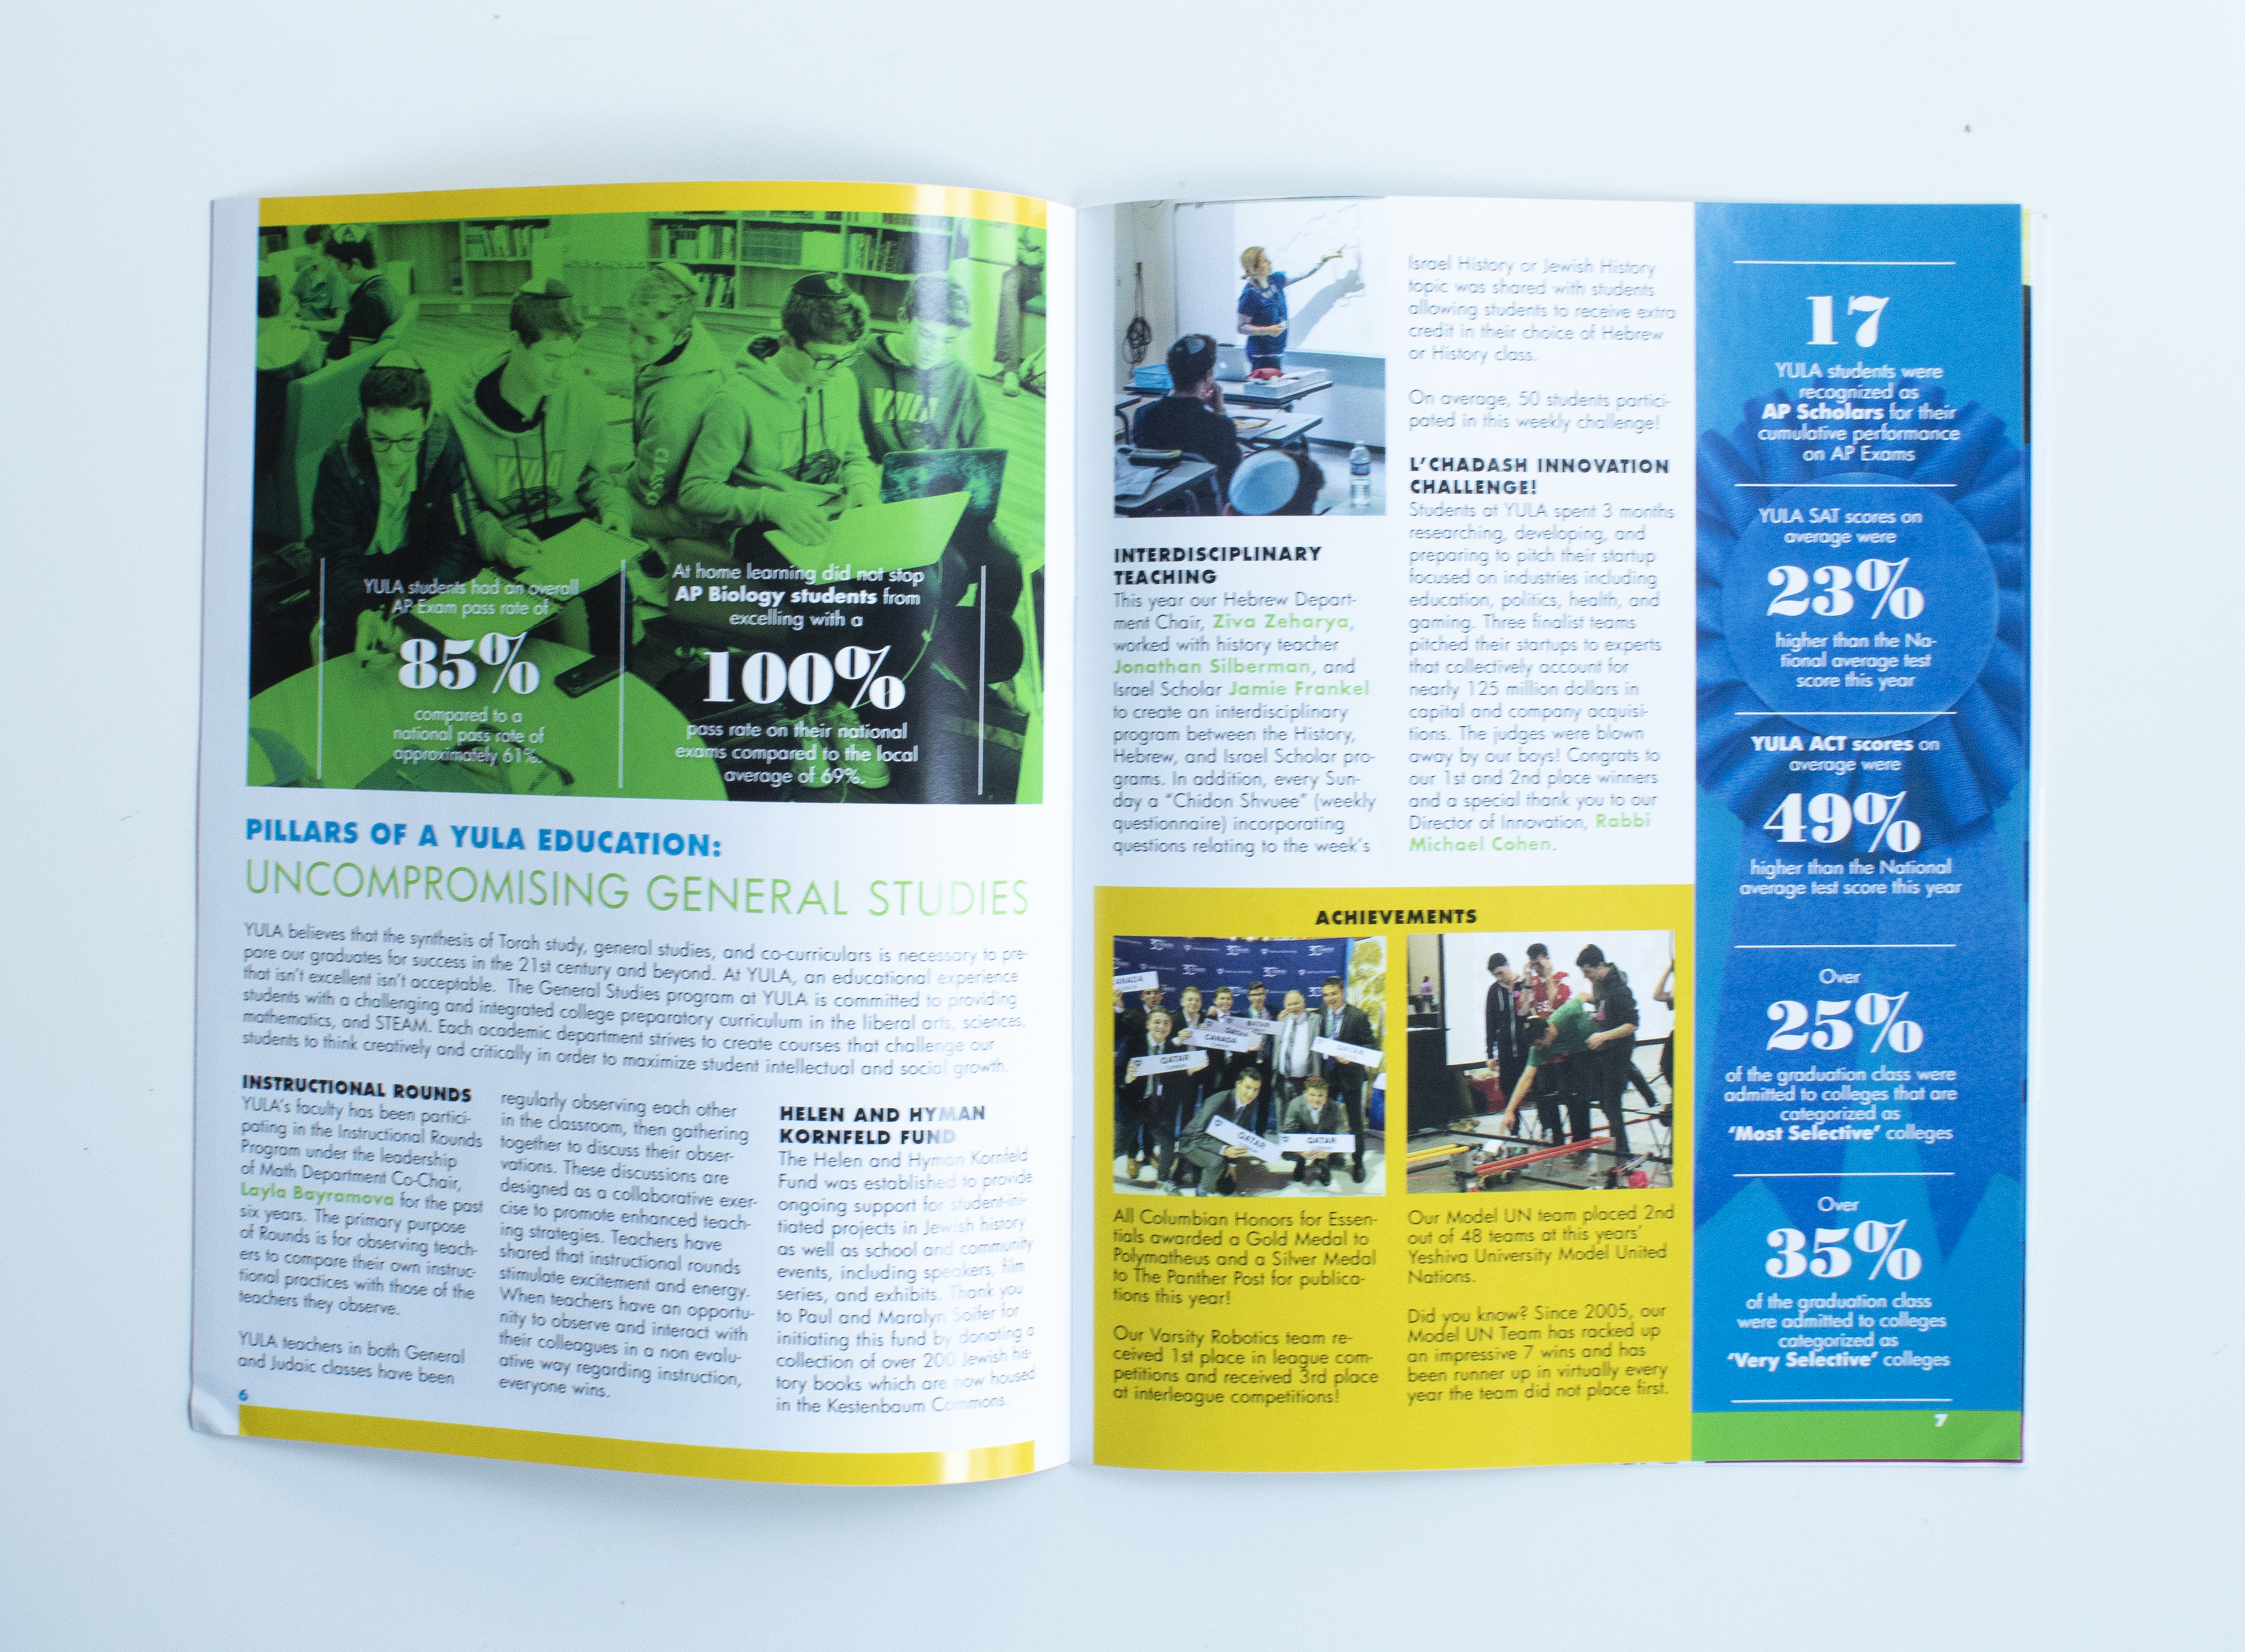
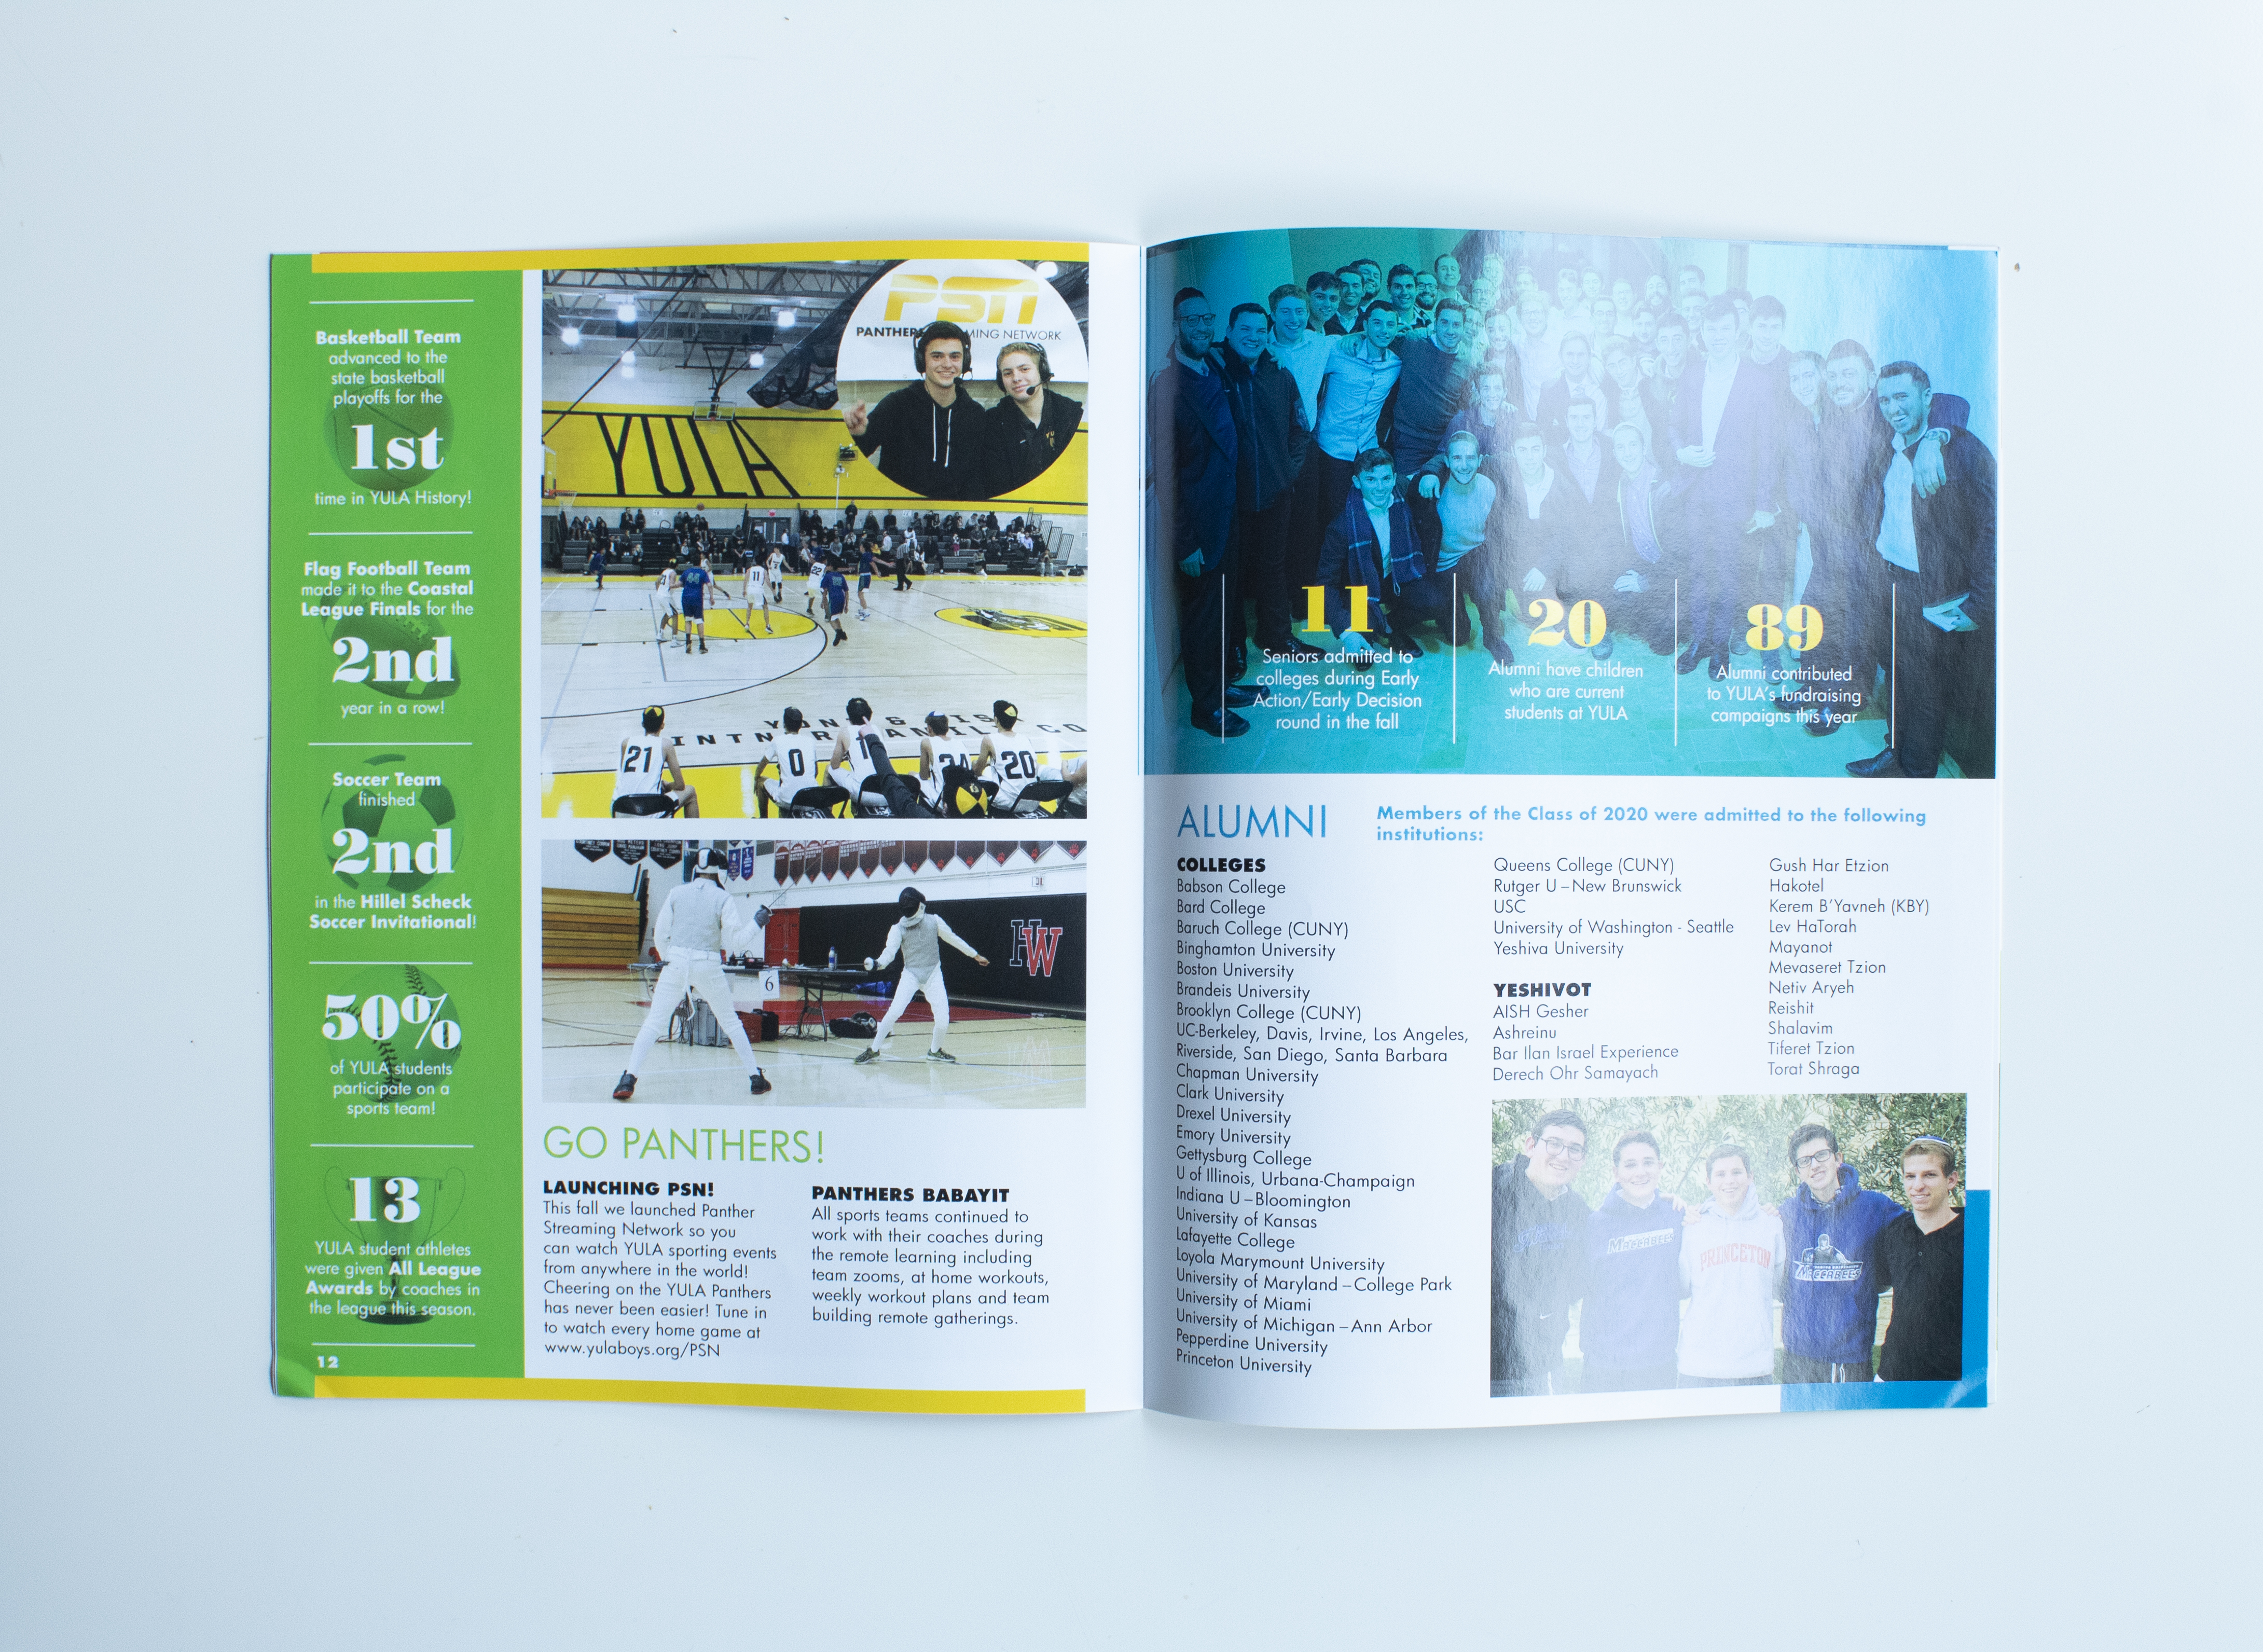
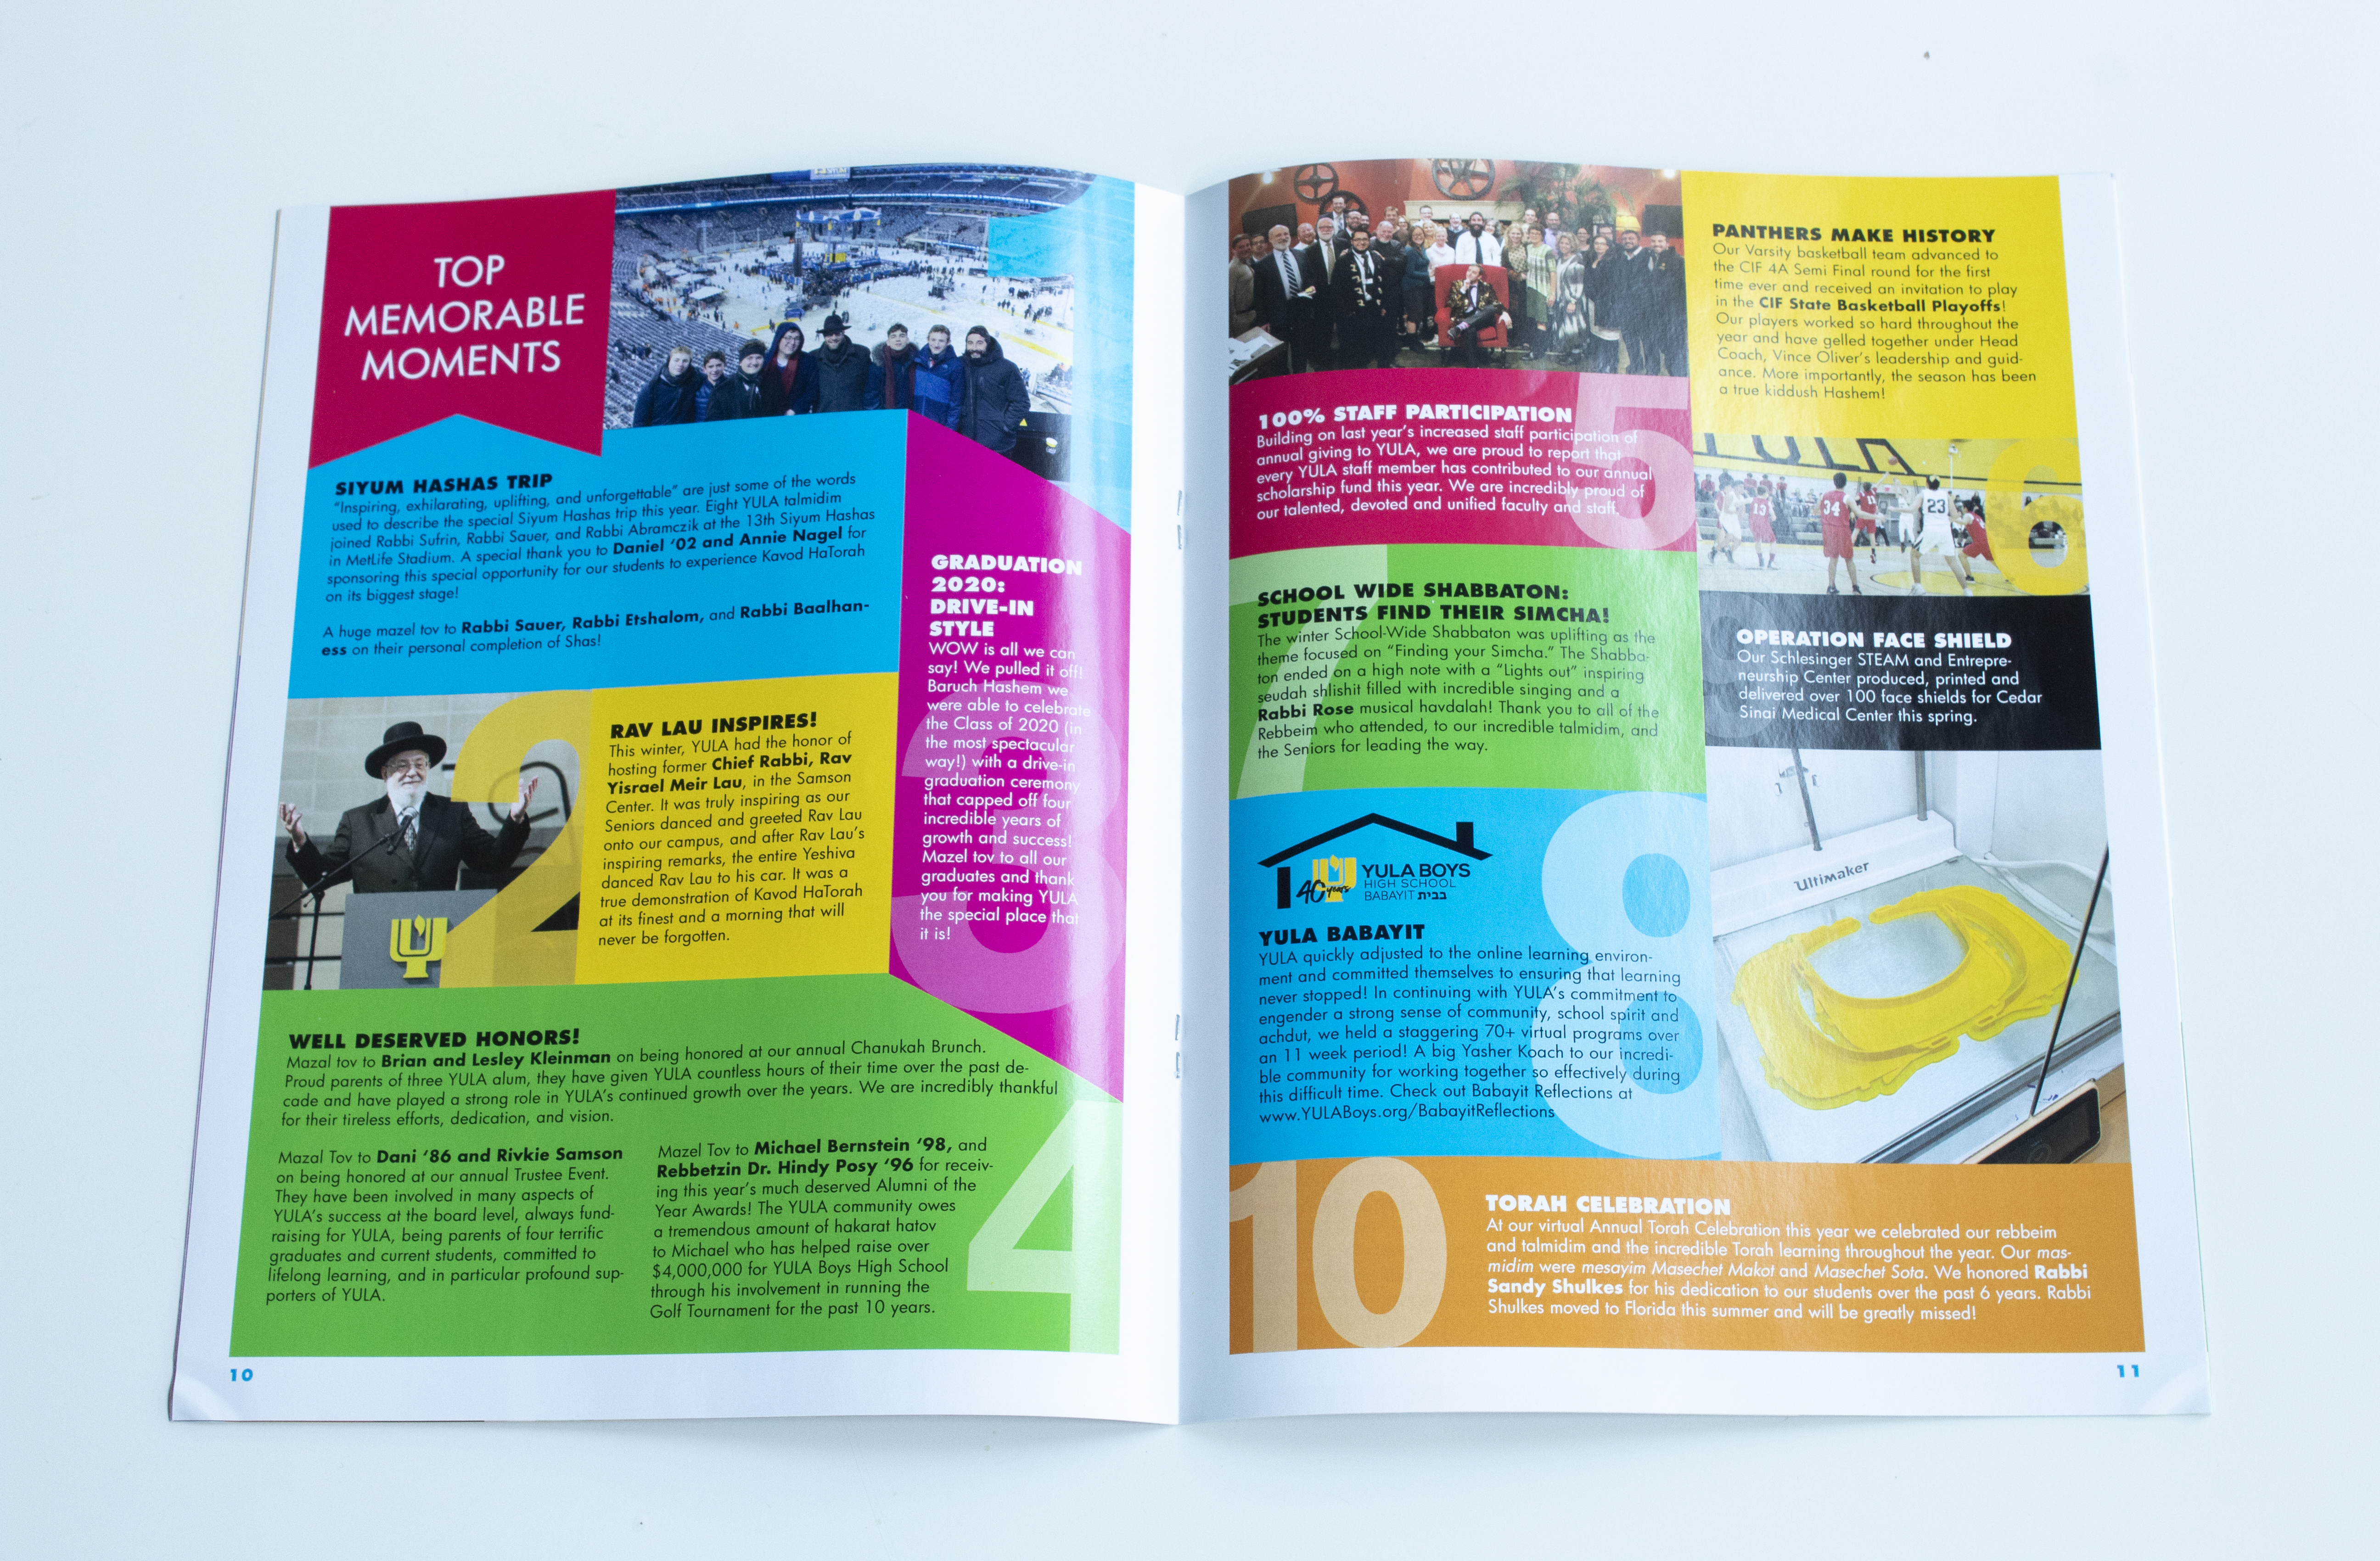
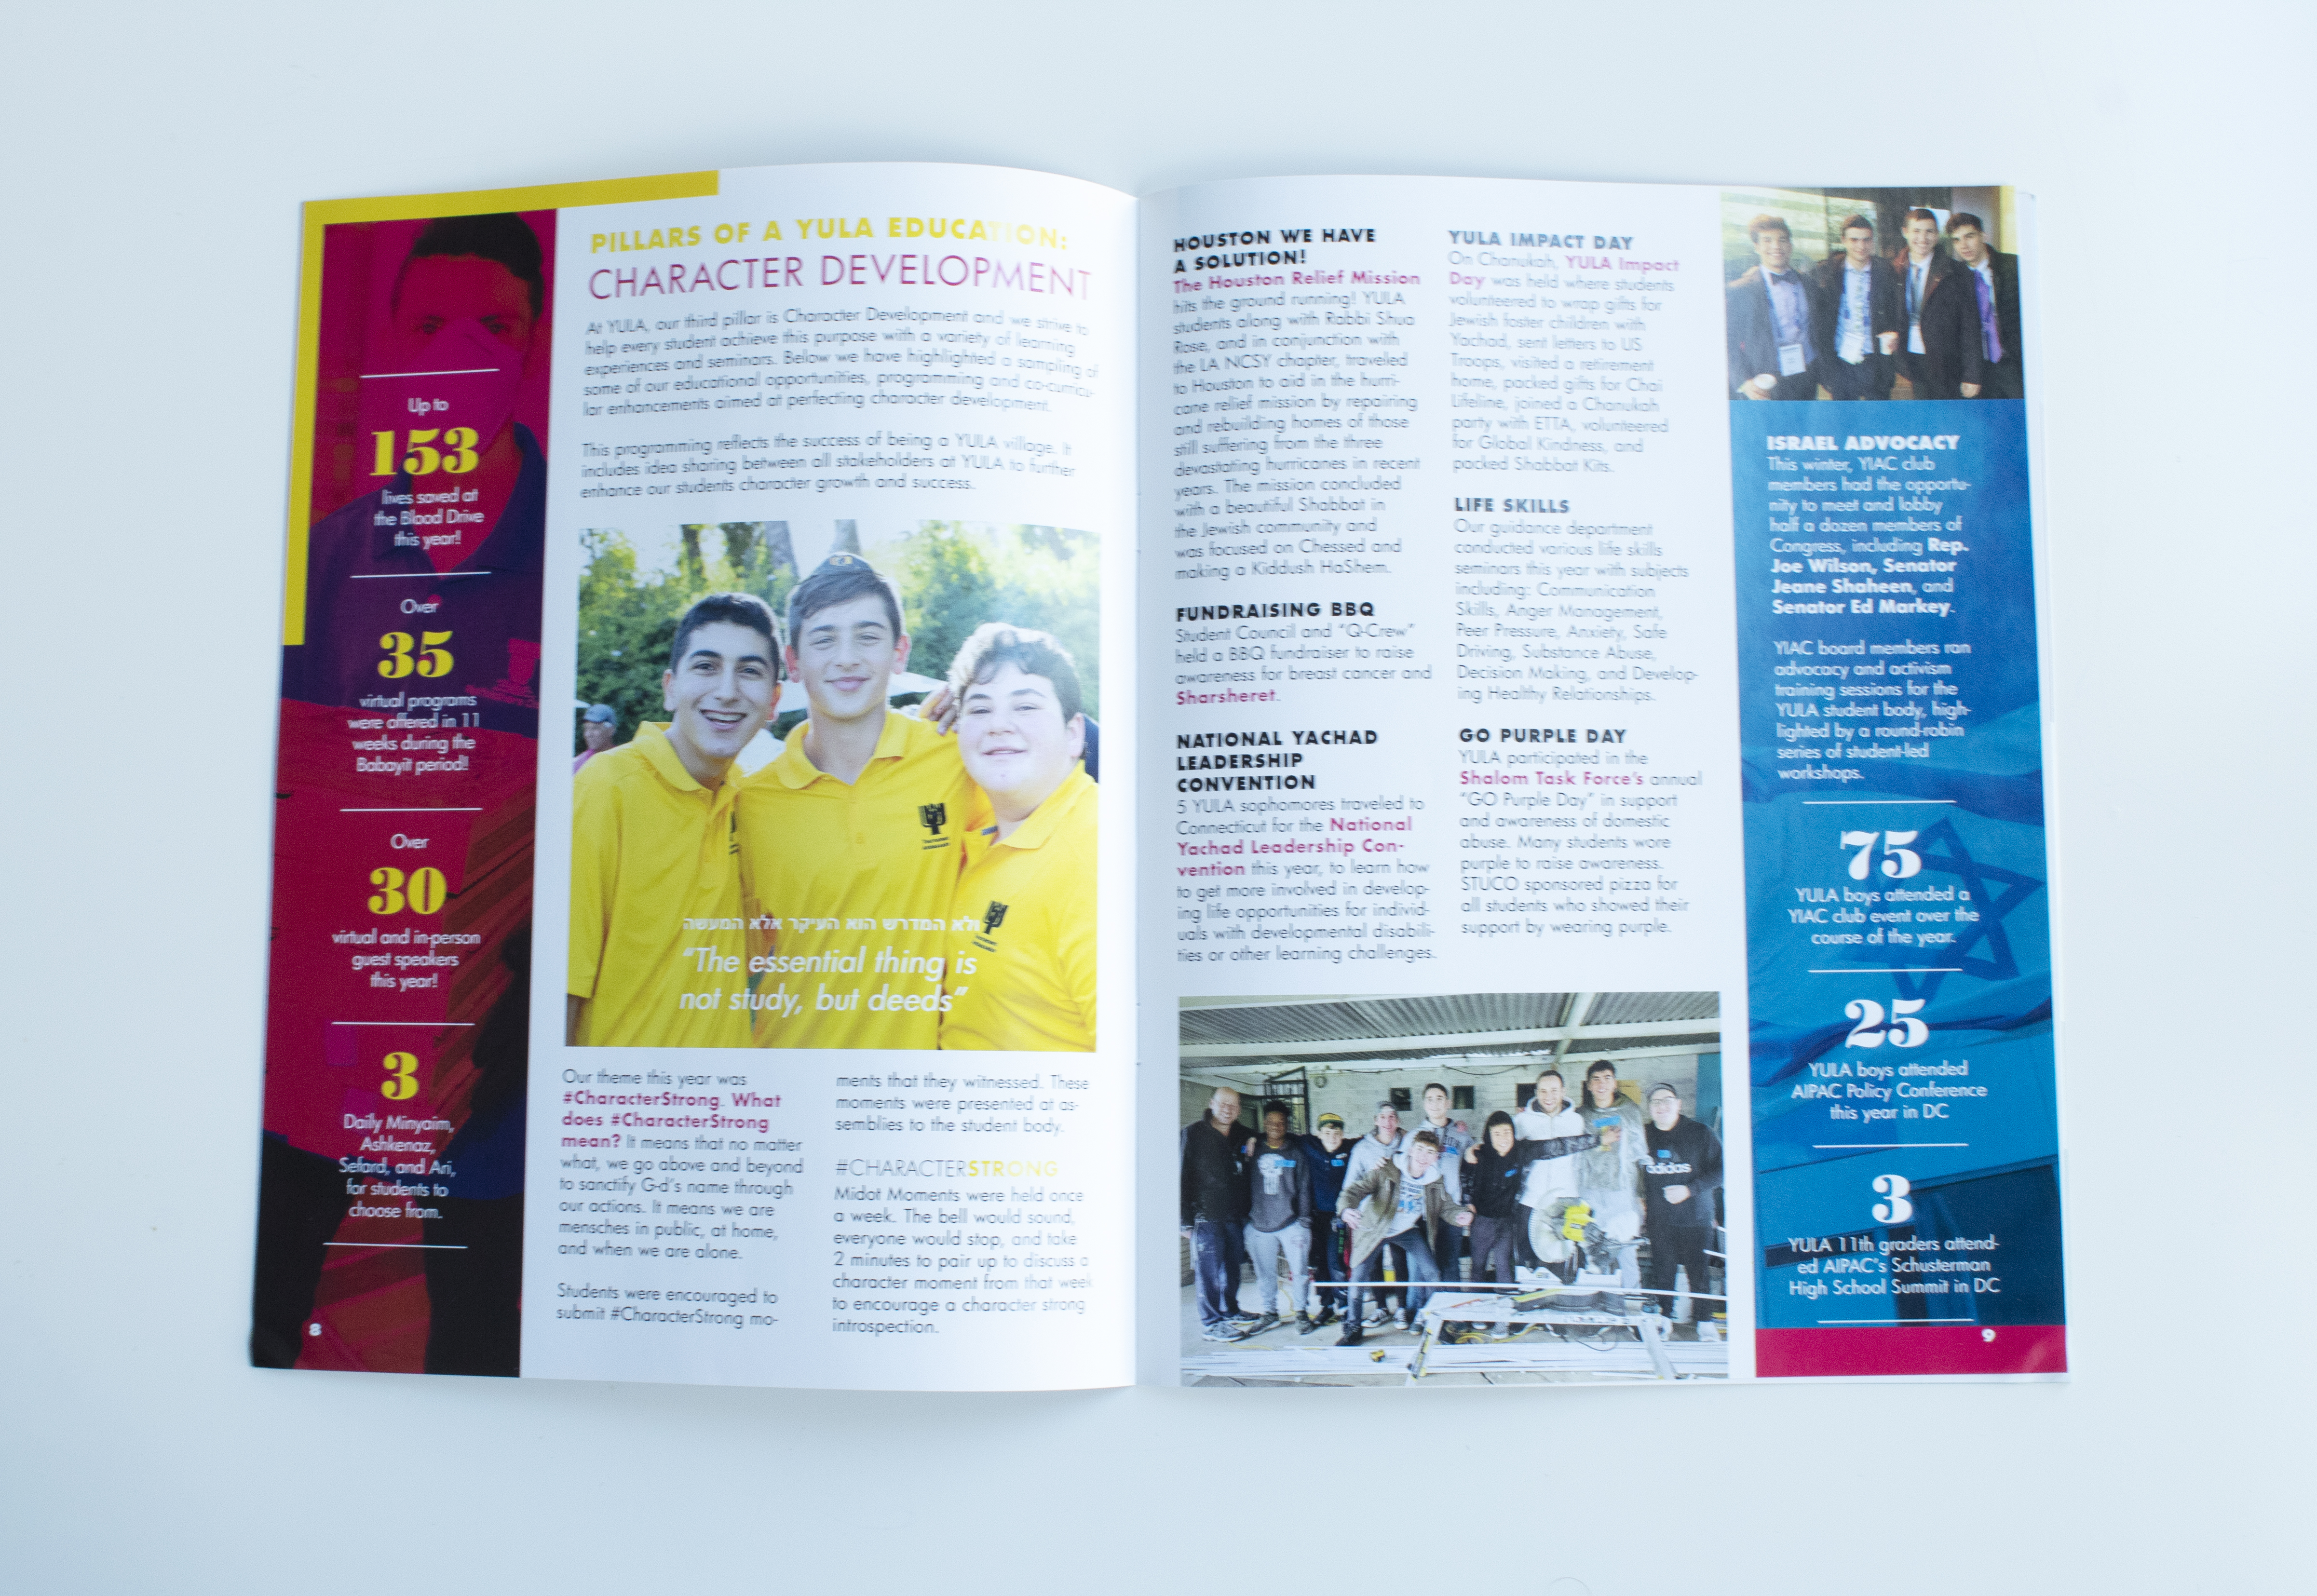
2020 Annual Report for Zbra Studios. This client loves bright colors and using up every bit of space in the style of a newsletter. To make the statistics easy to read and digest, I formatted them like infographics placing them in call-out boxes along the sides of the report. Photos were used throughout to give visual breaks from the copy-heavy report.
